CAPRI COVID-19 Round 51 - Target 182
This page provides information about the predictions and analyses of the CAPRI COVID Round 51, target T182.
Methodology
The results presented are of the Scorer submissions of Target 182.
Contacts: Contacts between entities were determined using a 5 Å distance threshold. Clashes (contacts below 2.5 Å), if any, were ignored. Only inter-chain contacts were considered.
Only heteromeric contacts were kept. Then, for all models, we counted the number of contacts (defined as “contact hits”), the number of contacts a residue makes at the interface (defined as “residue hits”), and the number of different residues a residue interacts with (defined as “distinct contacts”).
Sequence conservation: Sequence conservation was calculated using Rate4Site. Here, a low score means good conservation.
Target 182
The set consists of 181 models.
All the downloadable files can be found at the end of this page.
Target description
| Type | Ligand | Receptor | ||
|---|---|---|---|---|
| Species | SARS-CoV-2 | Homo sapiens (Human) | ||
| Name | Nsp15 | NUTF2 (homodimer) | ||
| Uniprot ID | P0DTD1 | P61970 | ||
| PDB Template | 6WLC | 1GY5 | ||
| Description | Multifunctional protein involved in the transcription and replication of viral RNAs. Contains the proteinases responsible for the cleavages of the polyprotein. | Mediates the import of GDP-bound RAN from the cytoplasm into the nucleus which is essential for the function of RAN in cargo receptor-mediated nucleocytoplasmic transport. Thereby, plays indirectly a more general role in cargo receptor-mediated nucleocytoplasmic transport. Interacts with GDP-bound RAN in the cytosol, recruits it to the nuclear pore complex via its interaction with nucleoporins and promotes its nuclear import. |
Analysis of viral protein
Visualization
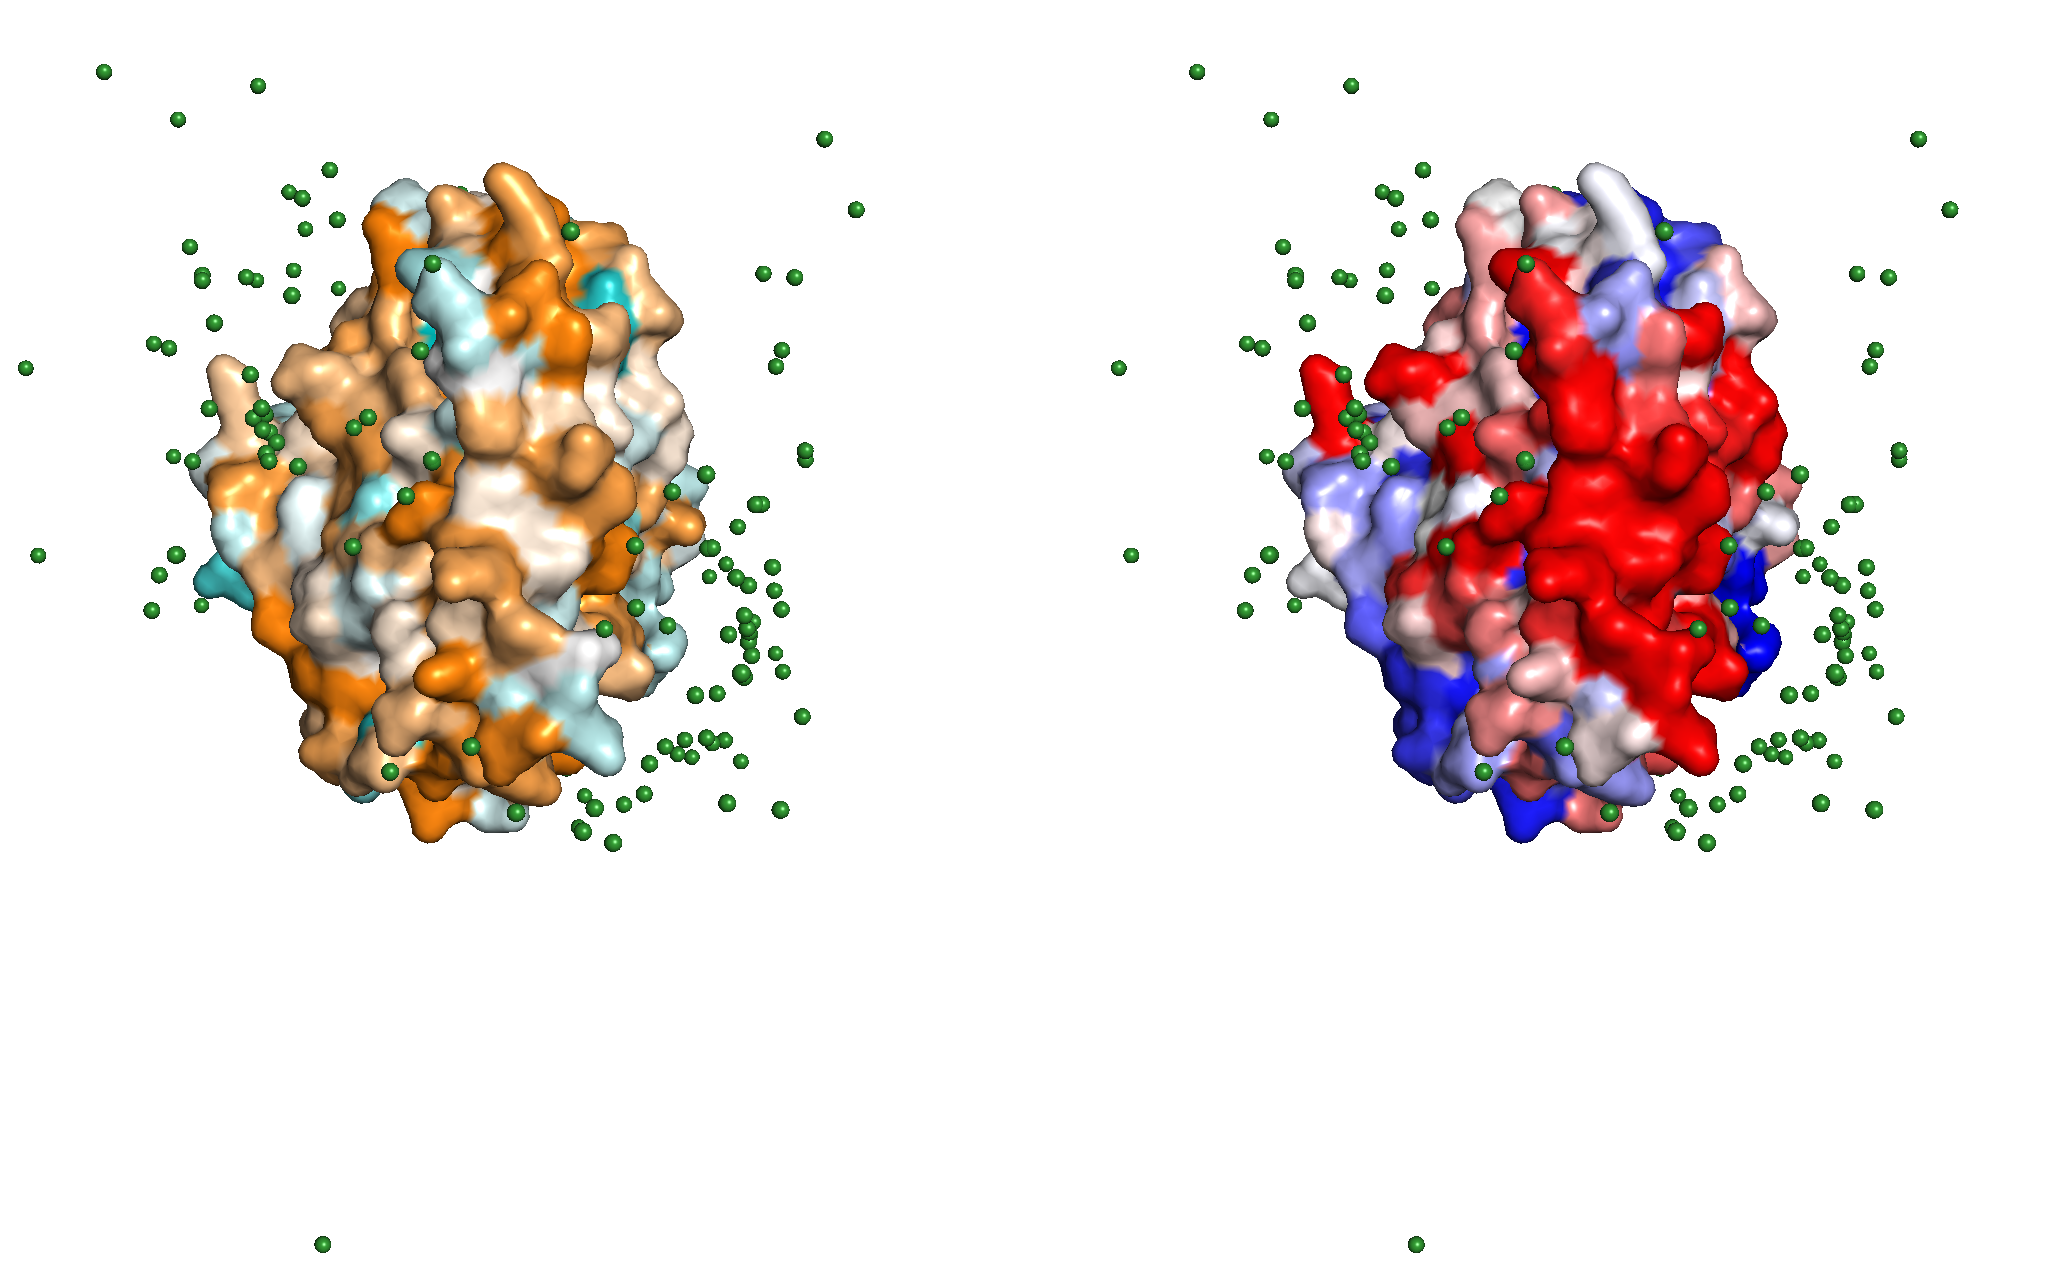
Surface representation of the ligand Nsp15 protein sequence conservation (left), coloring from orange (conserved) to teal (not conserved) and of the residue hits (right), colored from red (high occurrence, capped at the 90th percentile for better visualization) to blue (few occurrences). Green spheres are the center of mass of receptors for every model.
The PyMOL session where this image comes from can be downloaded here
Residue hit and conservation plot
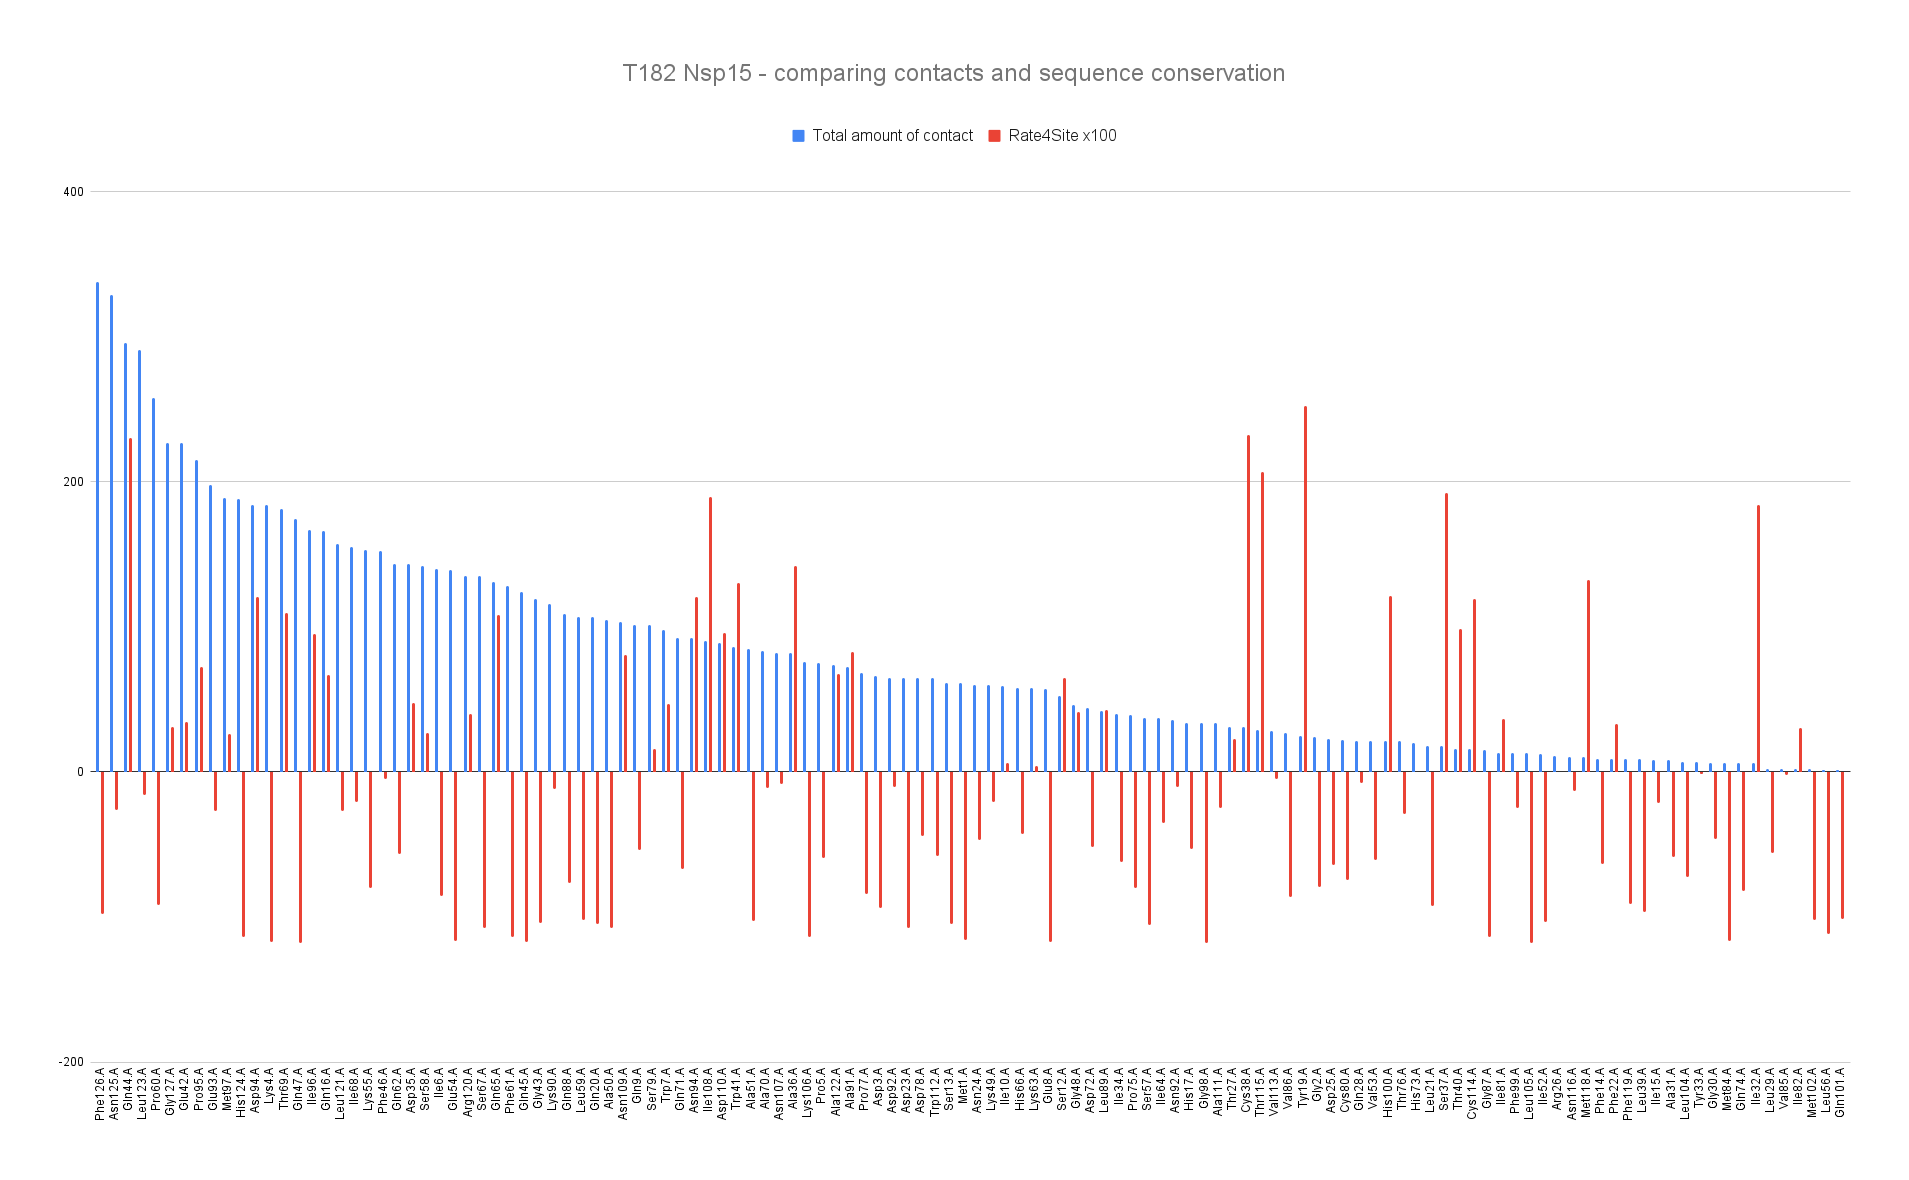
Barplot representing the residue hits (blue) and the sequence conservation (red) with Rate4Site score where the lowest means the most conserved of the Nsp15 residues.
Analysis of human protein
Visualization
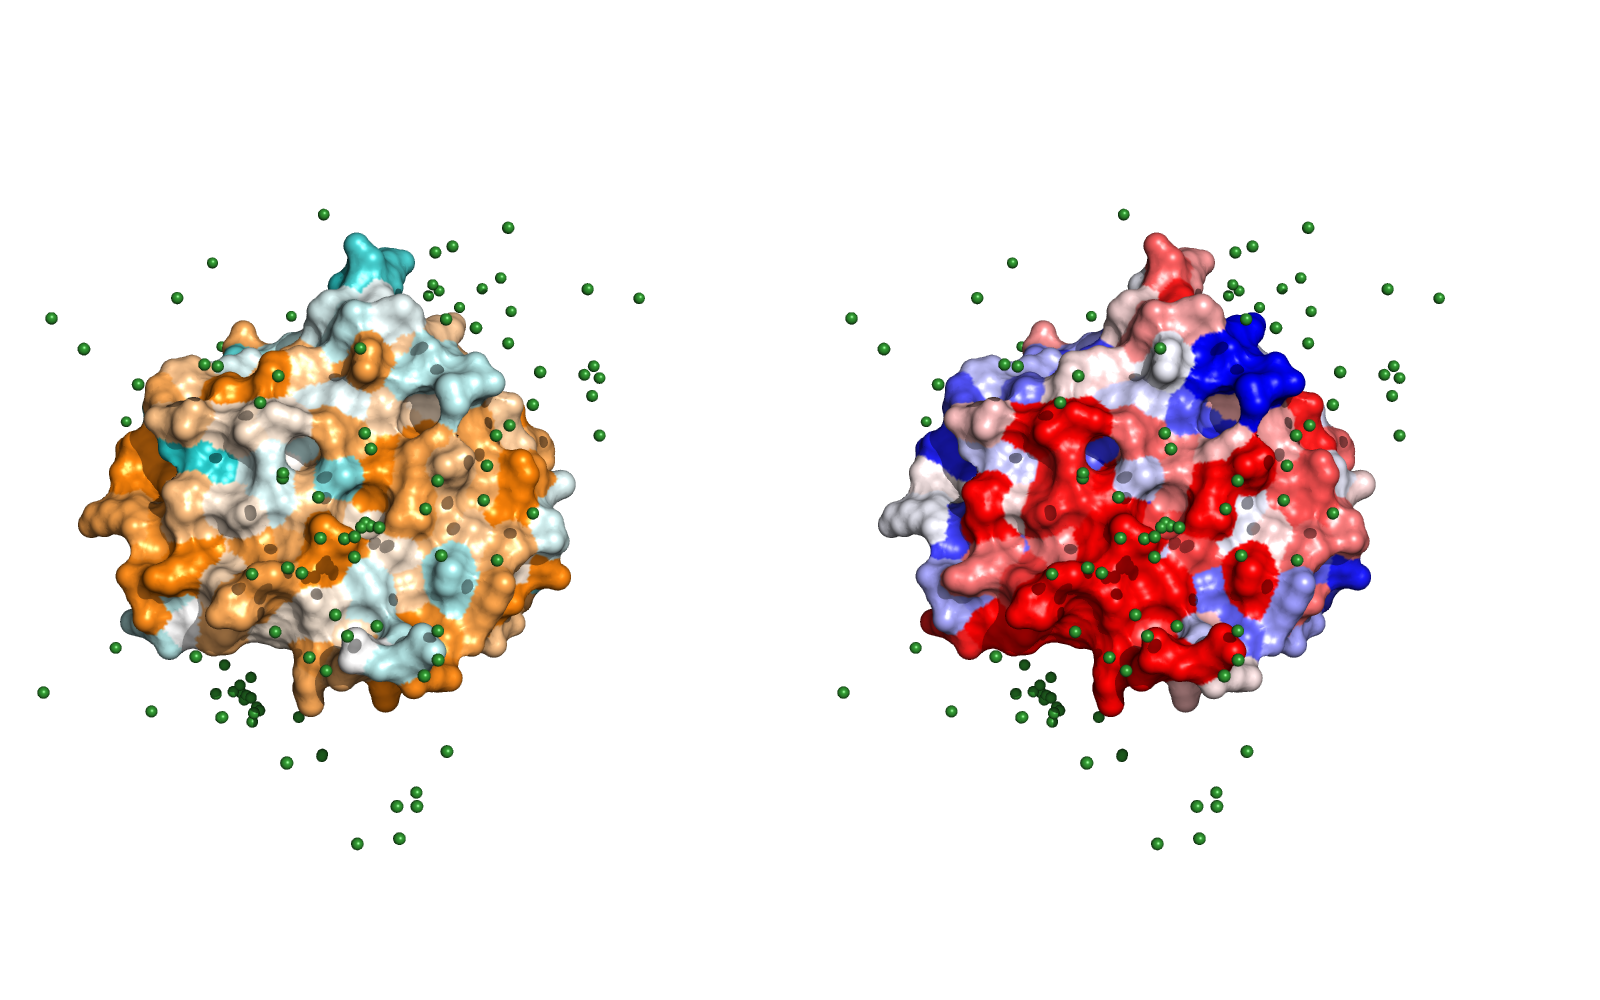
Surface representation of the ligand NUTF2 protein sequence conservation (left), coloring from orange (conserved) to teal (not conserved) and of the residue hits (right), colored from red (high occurrence, capped at the 90th percentile for better visualization) to blue (few occurrences). Green spheres are the center of mass of receptors for every model.
The PyMOL session where this image comes from can be downloaded here
Residue hit and conservation plot
Chain A
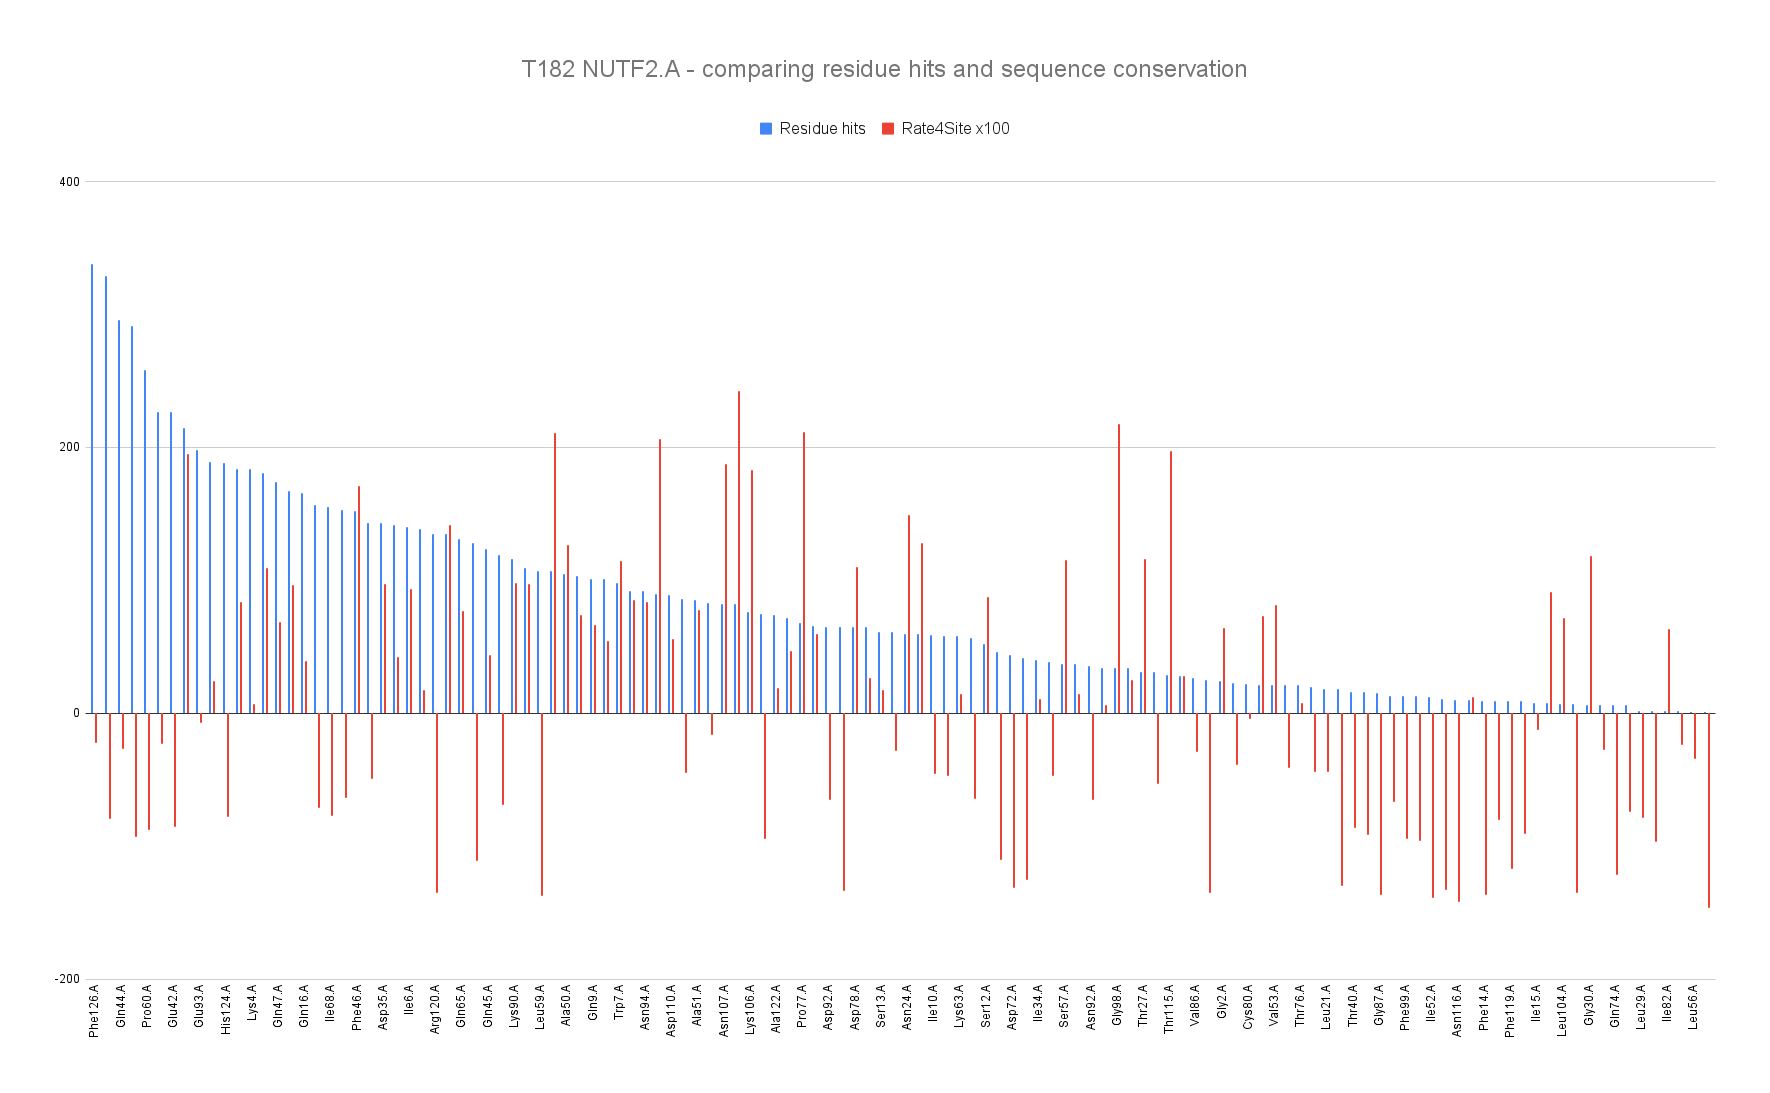
Barplot representing the residue hits (blue) and the sequence conservation (red) with Rate4Site score where the lowest means the most conserved of the NUTF2 chain A residues.
Chain B
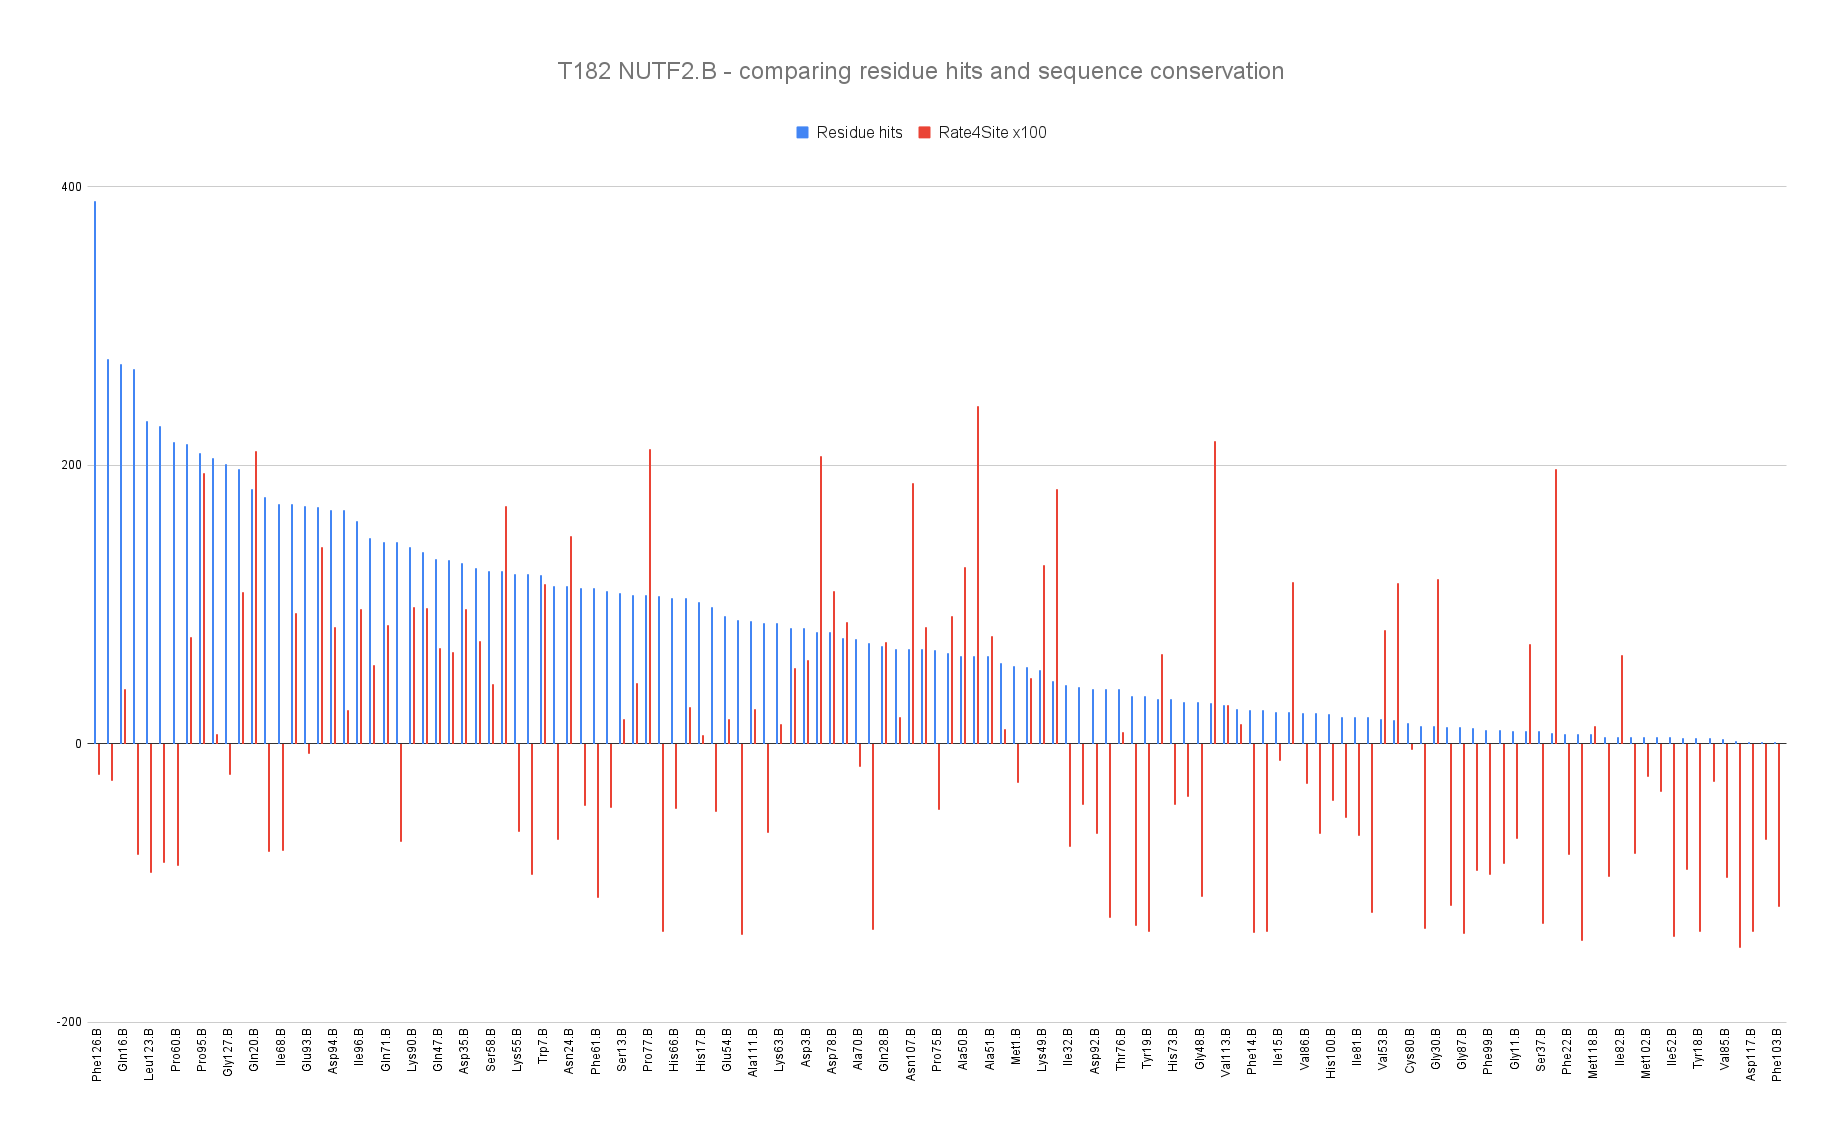
Barplot representing the residue hits (blue) and the sequence conservation (red) with Rate4Site score where the lowest means the most conserved of the NUTF2 chain B residues.
Downloadable files
| Target | PyMOL sessions | Contact hits | CSV files for receptor and ligand |
|---|---|---|---|
| T182 | T182_ligand / T182_receptor | T182_contact-hits | T182_csv |
The description of dowloadable files can be found here
For questions, comments or feedback please contact Marc Lensink or Théo Mauri

